Google contrail forecasts
Google contrail forecasts are available through the Google Contrails API. Access is free but requires an API key.
This notebook shows
How to access Google contrail forecasts with asynchronous HTTP requests (convenient when requesting large amounts of data)
How to preprocess Google contrail forecasts into the format expected by ContrailBench PCR benchmarks
Accessing Google forecasts
[12]:
import datetime
import os

import aiohttp
import cartopy.crs as ccrs
import matplotlib.pyplot as plt
import xarray as xr
The Google Contrails API accepts both forecast time and flight level as query parameters. However, omitting the flight level parameter to retrieve all available flight levels at once often leads to better performance when retrieving large amounts of data. The Google contrail forecast is probabilistic, and ContrailBench uses the persistent_formation_probability field for PCR benchmarks.
[13]:
time = datetime.datetime(2024, 6, 1, 0)

url = "https://contrails.googleapis.com/v2/grids"
params = {"time": time.isoformat(), "data": "persistent_formation_probability"}
headers = {"x-goog-api-key": os.environ["GOOGLE_API_KEY"]}

async with (
    aiohttp.ClientSession(raise_for_status=True) as session,
    session.get(url, params=params, headers=headers) as resp,
):
    content = await resp.read()
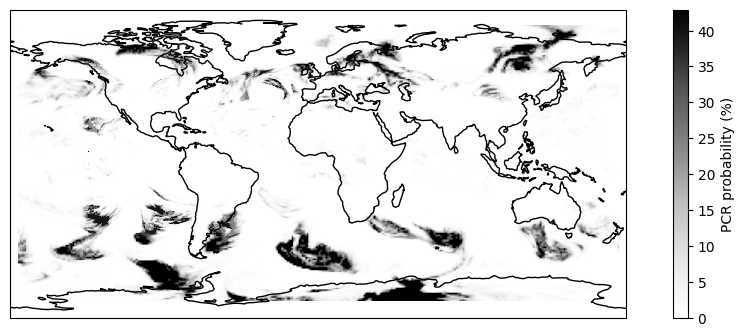
The Google Contrails API returns gridded forecasts as netCDF file. These can be opened using xarray after saving to disk.
[6]:
with open("forecast.nc", "wb") as f:
    f.write(content)

ds = xr.open_dataset("forecast.nc")
[10]:
plt.figure(figsize=(12, 4))
ax = plt.subplot(111, projection=ccrs.PlateCarree())
im = ax.pcolormesh(
    ds["longitude"],
    ds["latitude"],
    ds["persistent_formation_probability"].sel(flight_level=350).squeeze().T,
    shading="nearest",
    cmap="Greys",
    transform=ccrs.PlateCarree(),
)
plt.colorbar(im, ax=ax, label="PCR probability (%)")
ax.coastlines();
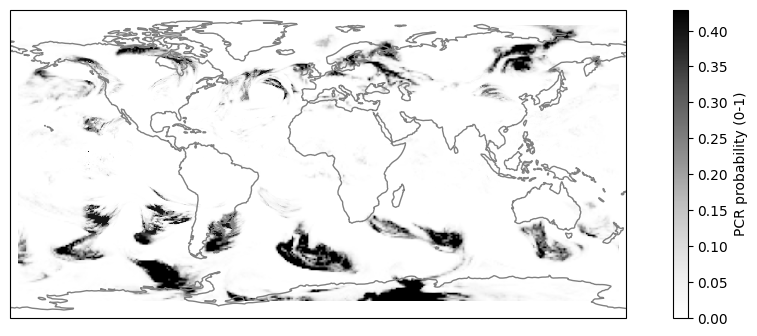
Preprocessing Google contrails forecasts
The probability field provided by the Google Contrails API can be used directly in ContrailBench PCR benchmarks with no additional preprocessing beyond standardizing variables names and units.
[9]:
ds["ppcr"] = ds["persistent_formation_probability"] / 100.0
processed = ds[["ppcr"]]
[11]:
plt.figure(figsize=(12, 4))
ax = plt.subplot(111, projection=ccrs.PlateCarree())
im = ax.pcolormesh(
    processed["longitude"],
    processed["latitude"],
    processed["ppcr"].sel(flight_level=350).squeeze().T,
    shading="nearest",
    cmap="Greys",
    transform=ccrs.PlateCarree(),
)
plt.colorbar(im, ax=ax, label="PCR probability (0-1)")
ax.coastlines(color="gray");